Skip to main content
Skip to footer
Epidemiology & Technology
Home
Stata
Containers
Docker
Proxmox
Traefik
Ubuntu
Manjaro
Windows
Mac
WordPress
Welcome
About Me
Publications
Home
Stata
Containers
Docker
Proxmox
Traefik
Ubuntu
Manjaro
Windows
Mac
WordPress
Welcome
About Me
Publications
Search site
Search
×
Blog Archive
Using RAAB6/RAAB7 Analysis R scripts on Desktop
The RAAB team has provided the analytic scripts on the GitHub repo. Once you download the scripts, you need some configuration on your desktopn to be able to use them. First is obviously you need to install R package. You also need to install pandoc [from here] Then you need
August 8, 2024
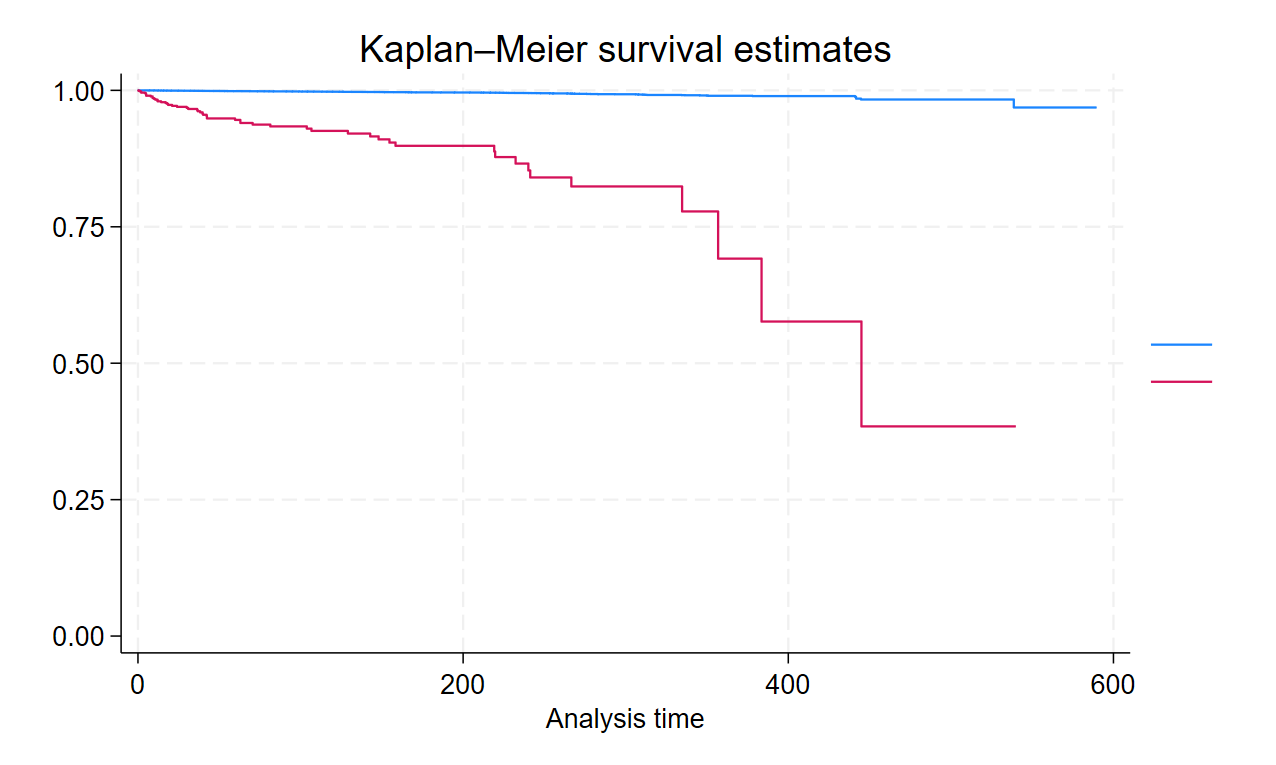
Survival Analysis in Stata
Cheat-sheet DETAILS A Key concept in survival analysis is ANALYSIS TIME. All analyses are performed in terms of time since becoming at risk, called analysis time. Subjects are exposed at t = time = 0 and later fail. Observations with t = time <= 0 are ignored because information before
July 22, 2024
Some resources for Stata Graphs
Apart from the routine, you can create some interesting graphs
June 29, 2024
Deviance and Deviance ratio in Logistic models
Once you start using logistic regression and have come beyond the basic model, you will start going into model diagnostics and comparison of model performances across various peculations for a specific outcome. you will then start coming across concepts of deviance and deviance ratios. Let us understand briefly, how to
June 19, 2024
Stata customised tables of Regression results
Stata added collect and enable suite of commands. I am discovering them now having migrated to Stata 18 from Stata 15. Useful Links Sample Output for etable using Collect suite SAMPLE OUTPUT for Collect
June 17, 2024
LASSO in Stata
Crossvaldiation By default, stata will select model with highest lambda. By default, stata fits up to 100 models with varying lambdas. The model with largest out of sample r-square and minimum CV mean prediction error gets selected by cross-validation LASSO commands SSC Addons based methods Stabdard Lasso estimation commands Lasso
May 24, 2024
Stata and ML resources
Some links to Stata and ML resources Conference Articles / Presentations / Stata Journal Stata Blog Articles from 2020 Other Resources Seven Steps in developing a prediction model Source: Towards better clinical prediction models: seven steps for development and an ABCD for validation - PMC (nih.gov)
May 20, 2024
Compact Results of Logistic Regression in Stata using ‘estout’ – ‘logisticresults’
After running a logistic regression in Stata, for inclusion in classical tables, one needs the Odds ratios and 95% confidence intervals. I have developed a small code snippet for getting reasonably compact unstyled results that can be easily copy-pasted in word or excel. This actts as a thin wrapper for
February 20, 2024
Easily get gender wise results of binary outcomes after survey data analysis in Stata
Problem Statement: You have a survey data and you wish to summarize your prevalence by gender Prerequisites: Stata Code Result You will get the outcome variable name in first column, male total, male %(95% CI), female total, female % (95%CI), total number, total % (95% CI). This can be copied
February 16, 2024
Generate EQ-5D-5L Utility Scores Indian norms
BASED ON Development of an EQ-5D Value Set for India Using an Extended Design (DEVINE) Study: The Indian 5-Level Version EQ-5D Value Set. Gaurav Jyani MPH 1, Atul Sharma PhD 1, Shankar Prinja MD 1, Sitanshu Sekhar Kar MD 2, Mayur Trivedi PhD 3, Binod Kumar Patro MD 4, Aarti
January 18, 2024