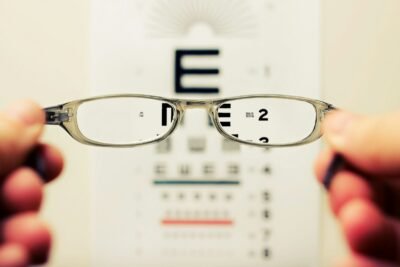
In order to simplify my life when dealing with variations in Visual Acuity Charts when dealing with data from different surveys, I have created the following table for VA conversions
What about PL+ / PL-, FCCF etc
LogMAR for 1/60 vision is 1.78, rounded off to 1.8 as used in RAAB analysis R code. For worse levels of visual acuity as measured in RAAB surveys, following values can be used
- Light Perception: 3.0
- No Light perception: 4.0
