Skip to main content
Skip to footer
Epidemiology & Technology
Home
Stata
Containers
Docker
Proxmox
Traefik
Ubuntu
Manjaro
Windows
Mac
WordPress
Welcome
About Me
Publications
Home
Stata
Containers
Docker
Proxmox
Traefik
Ubuntu
Manjaro
Windows
Mac
WordPress
Welcome
About Me
Publications
Search site
Search
×
Search Results
My M2 Pro MacBook Froze 5 Times in One Day – Here’s What I Found
Over 24 hr period, I had four or five system freezes on my M2 Pro 16GB/512GB MacBook Pro laptop. It was strange - noting too fancy happening - VS Code, Safari, 3-4 lightweight docker containers running Python, Celery, PostGres, Redis and system just randomly freezes. No warning, no crash dialog
March 12, 2026
MEDRES Custom fork of ODK Collect
GitHub Repository: drguptavivek/collectLast Updated: January 28, 2026Version: v2025.3.3-MEDRES-RC4Backend (ODK Central): Custom fork designed to work in tandem with MEDRES Collect Why MEDRES Exists Field medical research in resource-constrained environments faces unique challenges that standard data collection tools don't address. Researchers work in remote areas with unreliable connectivity, share devices across
January 28, 2026
glm_env for Switching GLM / Anthropic Claude Opus-Sonnet models easily in Claude Code
Add following to your ~/.bashrc or ~/.zshrc terminal profile file Close and reopen terminal or source the profile and set and unset the GLM env variables easily
January 24, 2026
Keycloak user Attributes, Realm Roles, Client Roles and Groups
User Attributes Realm Roles What user can do in the organziation - eg clincal role, system-admin, nursing, patient-registrations, laboratory-management Client Roles What role a user can have in a specific client Application - eg degree verifier, Groups Where in the organziation a user is positioned - Use it for tree
January 23, 2026
Keycloak SSO User Profiles
There are largely two ways user profile information can get added to the issued JWT Tokens User Attribues This is where long lived profile information should be saved.These are best used for static data about a user. Once created, data unlikely to change frequently. Realm > Realm Settings > User
January 23, 2026
PATH in Mac
To view current PATH System wide Path Locations User Specific Path config locations Of these, the .~/.zprofile is better for paths. Use ~/.zshrc for aliases and a custom prompts etc. Adding to Path on Mac References
January 22, 2026
Sample Size for Agreement
Estimation of Sampel Size for agreement is trial using R Sample size for three categories, Estimated Kappa 0.8, Null Hypothesis 0.7, Prevalence of three categories is 10%, 60%, 30%. Type I error 5% and power 90%
January 21, 2026
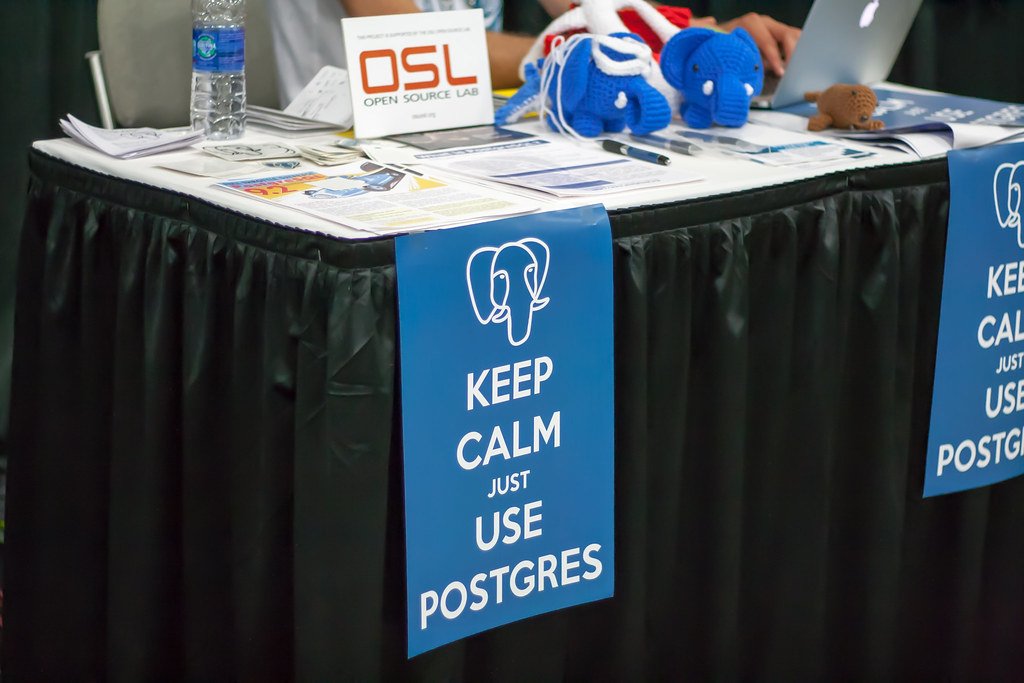
Postgres/ PostgreSQL 18 Docker containers
Postgres 18 is out. How to run it in containers easy Basic steps Backups Adding a new App specific Db and its specific db user Connection String
October 29, 2025
Public ReDash Dashboards with path based routing behind a Nginx reverse proxy
We had a use case where multiple ReDash dashboards were created. Some of the dashboards had to be made public. Login from public was to be disabled. We had a subdomain that was already serving few custom dashboards. Therefore the new rehash dashboards had to be served using path based
October 1, 2025
Sample Size for Diagnostic tests using R
Using SampleSizeDiagnostics package
September 12, 2025